
 Türkçe
 English


ABSTRACT
KEYWORDS
INTRODUCTION
MATERIALS AND METHODS
RESULTS
Our study population consisted of 48 children with HBoV infection, ranging in age from 1.5 to 102.0 months, with a median age of 18.5 months (IQR: 9.0-30.0). Sex distribution showed a slight male predominance, with 41.7% female patients and 58.3% male patients. Most of the children (85.4%) had no chronic diseases. However, among those with preexisting chronic conditions (14.6%), the most common was Down syndrome (6.3%). Hospital admission period ranged from June to December, with November accounting for the highest percentage of admissions (52.1%). When categorized by season, most admissions occurred in the autumn (64.6%). Regarding birth-related variables, most children were born via cesarean section (66.7%), in the term period (75.0%), and with an average birth weight for gestational age (85.4%). The results of the evaluation of the demographic, clinical, and laboratory data are presented in Table 1.
| n | % | ||
|---|---|---|---|
| Sex | Female | 20 | 41.7 |
| Male | 28 | 58.3 | |
| Chronic disease | None | 41 | 85.4 |
| Yes | 7 | 14.6 | |
| Down syndrome | 3 | 6.3 | |
| Epilepsy | 2 | 4.2 | |
| Hypothyroidism | 1 | 2.1 | |
| Hypotonicity | 1 | 2.1 | |
| Admission (month) | November | 25 | 52.1 |
| December | 12 | 25.0 | |
| October | 4 | 8.3 | |
| June | 3 | 6.3 | |
| September | 2 | 4.2 | |
| January | 1 | 2.1 | |
| February | 1 | 2.1 | |
| Autumn | 31 | 64.6 | |
| Admission (season) | Winter | 14 | 29.2 |
| Summer | 3 | 6.3 | |
| Type of birth | Cesarean section | 32 | 66.7 |
| NSD | 16 | 33.3 | |
| Birth week | Term | 36 | 75.0 |
| Preterm | 12 | 25.0 | |
| Birth weight | AGA | 41 | 85.4 |
| SGA | 6 | 12.5 | |
| LGA | 1 | 2.1 |
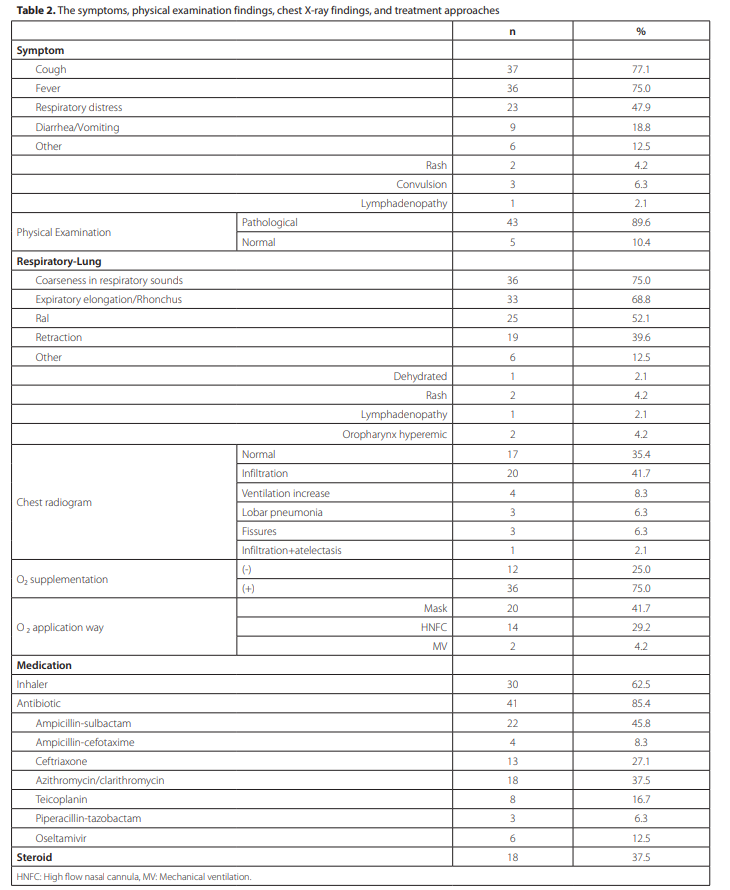
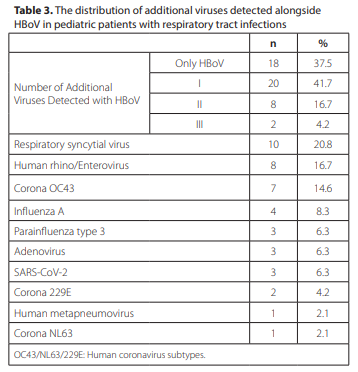
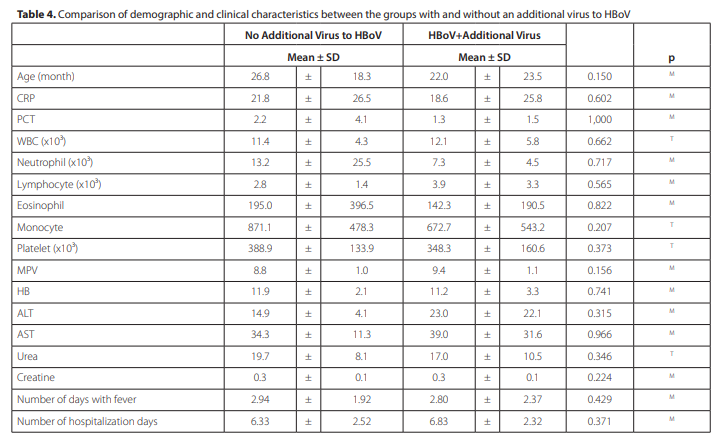
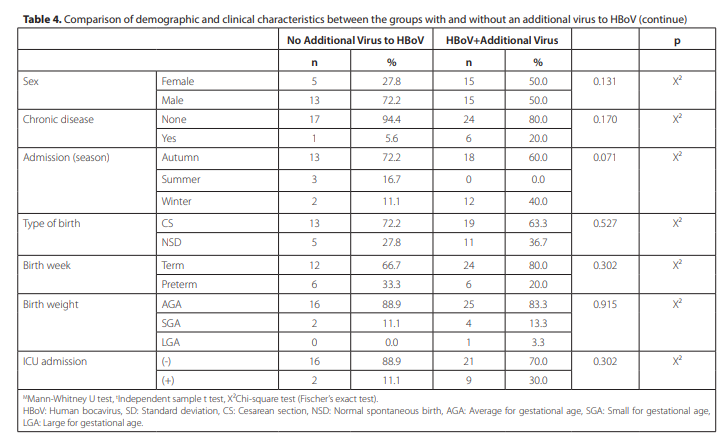
The most common symptoms observed in the children were cough (77.1%) and fever (75.0%). Respiratory distress was observed in 47.9% of the patients, and gastrointestinal symptoms such as diarrhea and vomiting were reported in 18.8% of the patients. Upon physical examination, 89.6% of the children showed pathological findings, with the most common being a coarse breathing voice (75.0%). Chest radiograms showed normal findings in 35.4% of the patients, whereas infiltration was detected in 41.7% of the cases. Regarding treatment, inhaler usage was reported in 62.5% of the patients. Most children (85.4%) received antibiotics until the virus was detected, and ampicillin-sulbactam was the most commonly used antibiotic (45.8%). A significant proportion of the patients (75.0%) required oxygen supplementation, with the most common method being via mask (41.7%). Mean number of febrile days was 2.85 (± 2.19 SD), with a median of 3.0 days. Mean hospital stay was 6.65 days (± 2.38) days. Among these patients, 22.9% required admission to the intensive care unit. Data related to the symptoms, physical examination findings, chest X-ray findings, and treatment approaches of the study population are presented in Table 2. Of the patients, 41.7% had one additional virus detected, 16.7% had two, and 4.2% had three. A sizable proportion (37.5%) of the patients showed no viruses other than HBoV. Regarding the specific viruses identified, respiratory syncytial virus was detected in 20.8% of the children. Human rhino/ enterovirus and coronavirus OC43 were detected in 16.7% and 14.6% of the samples, respectively. Table 3 illustrates the co-infection profile of the patients, detailing the number of additional viruses detected along with HBoV. In the group with no additional virus to HBoV, 72.2% were male and 27.8% were female, while the group with additional viruses had an equal distribution of sex (50.0% each; p= 0.131). In these groups, chronic disease was present in 5.6% and 20.0% of the patients, respectively (p= 0.170). The patients’ laboratory parameters were also compared, and no significant differences were found. In terms of birth characteristics, there were no significant differences in birth type, birth week, or birth weight. The length of hospital stay and requirement for intensive care unit (ICU) admission did not differ significantly between the two groups. ICU admission was required for 11.1% of the HBoV-only patients and 30.0% of those with coinfections (p= 0.302). High-flow nasal cannula (HNFC) was used more frequently in patients with co-infection (40.0% vs. 11.1%, p= 0.029) (Table 4). Cough was present in 77.8% and 76.7% of the patients, respectively (p= 0.929). The two groups showed no significant differences in the incidence of fever, respiratory distress, diarrhea/vomiting, rash, or other symptoms. Physical examination findings were similar between the groups. However, retraction was more frequent in patients infected two groups. Normal findings were reported in 27.8% of the patients without additional viruses and in 40.0% of those with additional viruses (p= 0.681). Table 5 compares the symptoms, physical examination findings, and radiological findings between patients with only HBoV and those with additional viral infections. Regarding oxygen supplementation, 72.2% of the patients without additional viruses and 76.7% of patients with additional viruses required oxygen supplementation (p= 0.731). HNFC was used more frequently in the group with additional viruses (40.0% vs. 11.1%). Mechanical ventilation was only required in the group with additional viruses (6.7%). There were no significant differences in the use of inhalers (p= 0.441) or antibiotics (p= 0.751). Finally, steroids were more common in the group with additional viruses, although the difference was not statistically significant (46.7% vs. 22.2%, p= 0.090). Table 6 compares the treatment and management strategies between the groups with and without additional viruses.
DISCUSSION
Our study contributes to the understanding of HBoV infections in pediatric patients, particularly in the context of lower RTIs. We revisit, validate, and extend various aspects of the existing literature to further enhance the comprehension
of this infection. In concordance with previous findings, such as those by Kesebir et al., our study’s demographics indicated a marginal male predominance, with a mean age of 23.8 months among HBoV infections (8). This finding suggests a potential sex-related disparity in susceptibility that warrants further exploration. The peak incidence of HBoV infections during autumn noted in our study is consistent with studies by Calvo et al. and Silva et al., suggesting a plausible relationship between environmental conditions and HBoV transmission (9,10). The seasonal pattern of HBoV infection, with a peak in autumn, is consistent with a body of research pointing to a higher frequency of HBoV infections during colder months (9,11). Liu et al. observed dual peaks in the prevalence of HBoV in the summer (from June to September) and winter (from November to December) months. They reported a notable positive association between the incidence of HBoV and average temperature, in contrast to a negative relationship with mean relative humidity. Interestingly, the mean temperature of the previous month provided a more robust explanation for prevalence than the temperature of the current month (12). This pattern suggests a possible relationship between environmental conditions and HBoV transmission, an area that requires further exploration. Our study found fever and cough to be the most common symptoms of HBoV infection, consistent with numerous previous studies, confirming the typical clinical profile of HBoV infection (3,9,10). The prevalence of these symptoms underscores the need for heightened diagnostic suspicion in pediatric patients presenting with such a clinical picture. The results of our study reaffirmed that fever and cough are the predominant symptoms associated with HBoV infection, a finding that corresponds with a number of previous studies, including those conducted by Bakir et al. and Kesebir et al. (1,8). This pattern of symptoms effectively consolidates the established clinical profile of HBoV infection. In light of these findings, it is evident that the prominence of these symptoms (fever and cough) calls for an elevated level of alertness and suspicion in the diagnostic process, particularly when dealing with pediatric patients exhibiting such symptoms. This is crucial, as early identification and appropriate management of HBoV infections can significantly impact the course of the disease, especially in this vulnerable population. However, it is noteworthy that while fever and cough are common symptoms, the presentation of HBoV infections can vary, and other symptoms or complications should not be dismissed. Here, we analyzed patients with a commonly lower RTI; however, HBoV infection may present with diarrhea, vomiting, rash, encephalitis, or eye symptoms (3,9,10). Furthermore, it is important to consider co-infections that may complicate or amplify symptomatology.
| No Additional Viruses to HBoV | HBoV+Additional Virus | p | |||||
|---|---|---|---|---|---|---|---|
| n | % | n | % | ||||
| Symptom | |||||||
| Fever | 13 | 72.2 | 23 | 76.7 | 0.731 | X² | |
| Cough | 14 | 77.8 | 23 | 76.7 | 0.929 | X² | |
| Respiratory distress | 7 | 38.9 | 16 | 53.3 | 0.332 | X² | |
| Diarrhea/Vomiting | 2 | 11.1 | 7 | 23.3 | 0.294 | X² | |
| Other | 2 | 11.1 | 4 | 13.3 | 0.822 | X² | |
| Rash | 2 | 11.1 | 0 | 0.0 | |||
| Convulsion | 0 | 0.0 | 3 | 10.0 | |||
| Lymphadenopathy | 0 | 0.0 | 1 | 3.3 | |||
| Physical Examination | Pathological | 16 | 88.9 | 27 | 90.0 | 1.000 | X² |
| Normal | 2 | 11.1 | 3 | 10.0 | |||
| Respiratory-Lung | |||||||
| Coarseness in respiratory sounds | 13 | 72.2 | 23 | 76.7 | 0.731 | X² | |
| In expiration/Rhonchus | 12 | 66.7 | 21 | 70.0 | 0.809 | X² | |
| Ral | 9 | 50.0 | 16 | 53.3 | 0.823 | X² | |
| Paravertebral retraction | 4 | 22.2 | 15 | 50.0 | 0.057 | X² | |
| Other | 3 | 16.7 | 3 | 10.0 | 0.499 | X² | |
| Dehydrated | 0 | 0.0 | 1 | 3.3 | |||
| Rash | 2 | 11.1 | 0 | 0.0 | |||
| Lymphadenopathy | 0 | 0.0 | 1 | 3.3 | |||
| Oropharynx hyperemic | 1 | 5.6 | 1 | 3.3 | |||
| Chest X-ray | |||||||
| Normal | 5 | 27.8 | 12 | 40.0 | 0.681 | X² | |
| Infiltration | 7 | 38.9 | 13 | 43.3 | |||
| Fissures | 3 | 16.7 | 0 | 0.0 | |||
| Lobar pneumonia | 3 | 16.7 | 0 | 0.0 | |||
| Ventilation increase | 0 | 0.0 | 4 | 13.3 | |||
| Infiltration+atelectasis | 0 | 0.0 | 1 | 3.3 | |||
HBoV: Human bocavirus.
| No Additional Viruses to HBoV | HBoV+Additional Virus | p | |||||
|---|---|---|---|---|---|---|---|
| n | % | n | % | ||||
| O₂ supplementation | (-) | 5 | 27.8 | 7 | 23.3 | 0.731 | X² |
| (+) | 13 | 72.2 | 23 | 76.7 | |||
| O₂ application way | Mask | 11 | 61.1 | 9 | 30.0 | ||
| HNFC | 2 | 11.1 | 12 | 40.0 | |||
| MV | 0 | 0.0 | 2 | 6.7 | |||
| Medication | |||||||
| Inhaler | 10 | 55.6 | 20 | 66.7 | 0.441 | X² | |
| Antibiotic | 15 | 83.3 | 26 | 86.7 | 0.751 | X² | |
| Ampicillin-sulbactam | 11 | 61.1 | 11 | 36.7 | 0.100 | X² | |
| Ampicillin-cefotaxime | 0 | 0.0 | 4 | 13.3 | 0.282 | X² | |
| Ceftriaxone | 4 | 22.2 | 9 | 30.0 | 0.557 | X² | |
| Azithromycin/clarithromycin | 7 | 38.9 | 11 | 36.7 | 0.878 | X² | |
| Teicoplanin | 4 | 22.2 | 4 | 13.3 | 0.424 | X² | |
| Piperacillin-tazobactam | 1 | 5.6 | 2 | 6.7 | 1.000 | X² | |
| Oseltamivir | 0 | 0.0 | 6 | 20.0 | 0.043 | X² | |
| Steroid | 4 | 22.2 | 14 | 46.7 | 0.090 | X² | |
HBoV: Human bocavirus, HNFC: High flow nasal cannula, MV: Mechanical ventilation.